USA Energy Exports (LNG & Renewables): The Changing American Footprint
: The Changing American Footprint")
- Apr 04, 2026
USA Energy Exports (LNG & Renewables): The Changing American Footprint
For much of the late 20th century, the United States was defined by energy dependence. In 2025, the story is almost the inverse: the U.S. is exporting large volumes of energy to global markets and influencing how countries think about supply security, pricing, and transition pathways.
From Energy Importer to Energy Supplier—and Now, Energy Shaper
As per USA Import Data by Import Globals, the American “energy footprint” is no longer only about barrels of oil—it increasingly spans liquefied natural gas (LNG), refined products, biofuels, electricity flows, and even the growing industrial capacity behind clean-energy hardware.
This shift has strategic consequences. U.S. energy exports help allies diversify away from unstable suppliers, give global buyers more options, and reshape trade balances. At the same time, the export surge raises hard questions: How much capacity can be added without tightening domestic markets? Can U.S. exports stay competitive as other exporters expand? And what does it mean for the energy transition if America’s biggest export growth remains fossil-heavy while “renewables” show up more as fuels, electrons, and equipment?
The Scale in One Line: A Record Share of U.S. Energy Production is Being Exported
By 2024, the U.S. exported about 30% of its domestic primary energy production—a record 31 quadrillion BTUs (quads) exported out of 103 quads produced. As per USA Export Data by Import Globals, that statistic matters because it describes an economy that is not merely self-sufficient; it is a major supplier to the rest of the world. The export mix is still dominated by fossil fuels, but the footprint is widening as biofuels and electricity become more material at the margins.
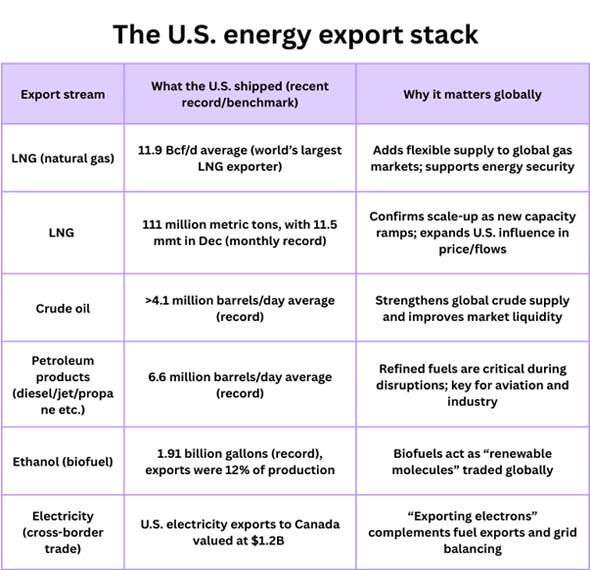
LNG: America’s Signature Export—and a Geopolitical Lever
LNG is the headline product of the new American footprint. As per USA Import Export Trade Data by Import Globals, the U.S. shipped an average 11.9 billion cubic feet per day (Bcf/d) of LNG in 2024, keeping its position as the world’s largest LNG exporter. But 2025 pushed the story further: total U.S. LNG exports reportedly exceeded 100 million metric tons for the first time, reaching 111 mmt, with multiple monthly records during the year. Europe remained a top destination, reflecting a continuing effort to secure non-Russian supply and diversify import portfolios.
What makes LNG strategically powerful is flexibility. As per USA Import Custom Data by Import Globals, LNG can be rerouted, contracted long-term or traded spot, and shipped to whichever market needs it most. In a world of weather shocks, pipeline constraints, and geopolitical risk, that flexibility carries premium value.
The Competitive Edge in LNG is not Just Gas Production. It’s also:
- Liquefaction capacity (terminals that turn gas into LNG)
- Shipping availability and contract structures
- Reliability (maintenance, outages, operational performance)
- Regulatory pathways that determine whether new terminals get built
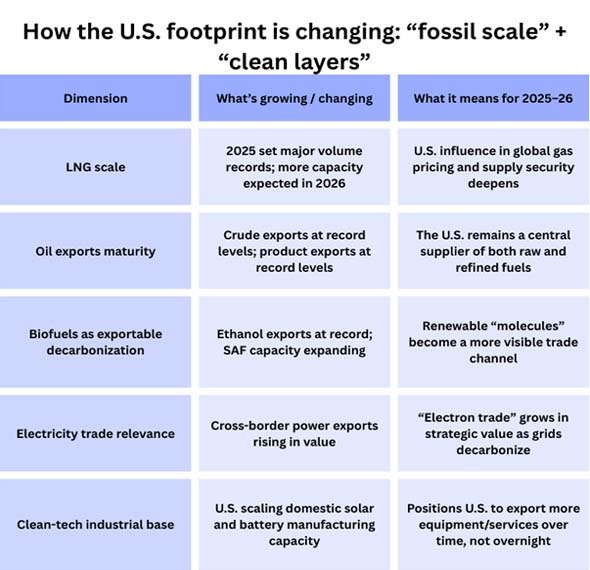
As per USA Import Trade Analysis by Import Globals, looking into 2026, more U.S. capacity is expected to come online, which could deepen America’s role as a balancing supplier in global gas markets.
Crude Oil Exports: A Record Flow From a Record Producer
Alongside LNG, crude oil exports show how thoroughly U.S. energy trade has flipped. In 2024, U.S. crude oil exports exceeded an annual average of 4.1 million barrels per day, setting a new record. Growth slowed compared with the earlier post-shale surge, but the level remains historically high.
As per USA Exporter Data by Import Globals, this matters for two reasons. First, it reinforces global supply diversity: more U.S. barrels in the seaborne market can reduce dependence on a smaller group of exporters. Second, it makes the U.S. more connected to the world oil price market: when the U.S. exports a lot, producers in the U.S. have to pay attention to both U.S. demand and international margins and logistics.
Crude exports also reflect infrastructure maturity—pipelines to the Gulf Coast, terminal capacity, and shipping logistics that allow U.S. grades to compete abroad.
Refined Products: The Quieter Export Powerhouse
As per USA Importer Data by Import Globals, if LNG is the headline and crude is the symbol, refined products are the workhorse. In 2024, U.S. exports of total petroleum products rose to a record 6.6 million barrels per day. Growth was driven notably by higher exports of distillate fuel oil (diesel) and jet fuel, even as gasoline exports declined.
As per USA Import Trade Statistics by Import Globals, refined product exports matter because they hit the economy directly: transportation, aviation, farming, mining, and manufacturing all rely on refined fuels. In supply disruptions—refinery outages, sanctions, shipping bottlenecks—diesel and jet fuel availability becomes a frontline issue. This is where the U.S. footprint is often most visible: supplying fuels that keep other economies moving.
“Renewables” in Exports: Not Just Panels and Turbines—think Molecules and Electrons
When people hear “renewables exports,” they often imagine solar panels, wind turbines, or batteries shipped abroad. The U.S. does export clean-energy equipment and services, but the more immediate renewable footprint shows up in two tradable forms:
1) Renewable Molecules: Ethanol Today, SAF tomorrow
U.S. biofuels—especially ethanol—are already a meaningful export channel. In 2024, U.S. ethanol exports surged to a record 1.91 billion gallons, and exports made up a record 12% of domestic ethanol production. In 2025, exports increased further as a share of production (about 13% through the first seven months), with a notable portion of the growth going to the Netherlands—showing how biofuels can move through global blending mandates and price signals.
As per USA Import Shipment Data by Import Globals, sustainable aviation fuel (SAF) is a newer frontier. The U.S. is expanding SAF capacity from a small base, aiming to grow production and, eventually, develop exportable volumes or at least reduce jet fuel emissions intensity domestically while building technology and scale advantages.
2) Exporting Electrons: Cross-border Electricity Trade
Electricity trade is smaller than oil and gas in volume terms, but it is strategically meaningful. U.S. electricity exports to Canada rose in value to $1.2 billion in 2023. Power trade supports grid reliability and helps manage seasonal and regional variations. As more renewables enter North American grids, flexible cross-border power flows become more valuable—because balancing becomes harder and the marginal value of “firm” supply rises.
What Holds the Footprint Together: Infrastructure, Contracts, and Policy
Exports at this scale don’t happen by accident. As per USA Import Export Trade Analysis by Import Globals, the American footprint is built on three pillars:
- Infrastructure: LNG terminals, pipelines, ports, storage, refineries, and grid interconnections.
- Market structures: long-term LNG contracts, global oil market liquidity, and flexible product flows.
- Policy and permitting: export authorizations, environmental rules, and the pace at which new projects are approved and financed.
In 2025–26, policy signals are just as important as geology. For LNG in particular, getting permits and export clearances can decide if the U.S. maintains growing or goes through a period of slower growth.
The Key Problems Are Between Security, Affordability, and Reducing Carbon Emissions
A Shifting Footprint Means Making Choices:
- Security: As per USA Export Import Global Trade Data by Import Globals, more exports aid our partners throughout the world and provide us more options for where to get goods.
- Affordability: If exports grow faster than production, prices at home can go up, especially for natural gas in some areas.
- Decarbonization: Fossil-heavy exports can get in the way of climate goals if they aren't accompanied with cuts in emissions, better management of methane, more efficiency, and an increase in clean exports at the same time.
The likely outcome in the near term is not a sudden pivot away from fossil exports, but a layering effect: LNG and refined fuels remain large while biofuels, electricity trade, and clean-tech capacity gradually expand the “renewables share” of the American footprint. Import Globals is a leading data provider of USA Import Export Trade Data.
FAQs
Que. Why is U.S. LNG so important globally?
Ans. Because LNG is flexible and can be shipped to whichever region needs it most, helping countries diversify supply and manage disruptions.
Que. What’s the difference between crude oil exports and petroleum product exports?
Ans. Crude is unrefined oil. Petroleum products are refined fuels and liquids (diesel, jet fuel, propane, gasoline). Product exports often matter more for immediate economic activity.
Que. Are U.S. “renewables exports” mainly solar panels and wind turbines?
Ans. Not yet at the same scale as fuels. In practice, the most visible renewable export today is biofuels (like ethanol), plus smaller but strategic electricity exports and a growing clean-tech manufacturing base.
Que. Will the U.S. maintain sending more LNG to other countries in 2026?
Ans. New capacity is expected to come online, which supports growth, but actual outcomes depend on project timelines, global demand, and policy/permitting conditions.
Que. Where to get detailed USA Import Export Global Data?
Ans. Visit www.importglobals.com.